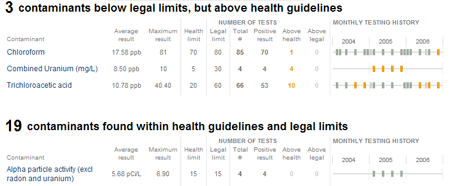
I’m way overdue in updating my blog, but thought I’d post about the latest project we launched tonight, which is a database showing the contaminants that have been tested for — and detected — in nearly every water system in the U.S.
Data comes from the Envrionmental Working Group, which collected the testing history for nearly every water system in nearly every state.
The most interesting part of the project for me, at least, was generating the timelines of the testing history for each contaminant in each water system. It was my first foray into using processing for the mass generation of charts — I ended up generating 3.2 million individual PNG files: one for each contaminant in each water system.
To speed the download time, I also used ImageMagick — another great open source tool which I’ve long been a fan of — to combine all the seperate files for a single water system into a single PNG file. Tyson Evans and Brian Hamman worked out the code use the file as a background image for each contaminant listed on the page, scrolled to show the appropriate row from the image.
Anyway, check out the full project here: http://projects.nytimes.com/toxic-waters/contaminants
(Other little bit of fun: the “N.A.” labels in the graphic are in Silkscreen, Jason Kottke’s lovely bitmapped font for small type — as a font nerd, I’ve been looking for an excuse for a while to work Silkscreen into a graphic.)
