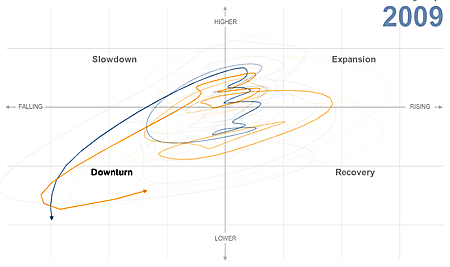
I’m a little late in posting this, but Amanda Cox had a fabulous graphic in the Sunday Business section this week. She took data on industrial production and showed how it indicates business cycles in the economy. (And my favorite part: watching the industrial production data chase the leading indicators on the final frame.)

That is amazing